
March 2025 North Texas Real Estate Market Update – Trends & Insights

Overall Market Trends
The Dallas-Fort Worth housing market saw further normalization this March, with continued year-over-year price adjustments, higher inventory levels, and a noticeable increase in days on market. Buyers are taking more time to make decisions, while sellers face more competition across most price points. These trends are consistent with what we observed in February, though the shift is becoming more pronounced as we move into the spring season.
Dallas County
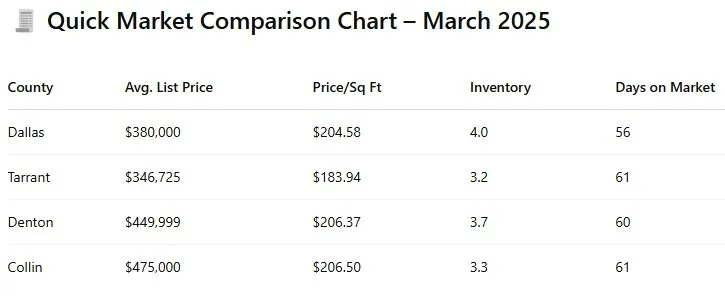
Average List Price: $380,000 ↑ up 2.4% YoY
Median Price per Sq Ft: $204.58 ↓ down 1.0% YoY
Months of Inventory: 4.0 ↑ up 1.2 YoY
Average Days on Market: 56 Days ↑ 11 Days YoY
Dallas County saw the highest year-over-year list price growth of the four counties, up 2.4%. While this may suggest strength, a closer look reveals a slight dip in price per square foot and longer selling timelines, signaling that sellers are pricing optimistically while buyers remain selective. Inventory remains healthy at 4.0 months — the highest across DFW — offering more choices for buyers without tipping the market into oversupply.
Tarrant County
Average List Price: $346,725 ↑ up 0.5% YoY
Median Price per Sq Ft: $183.94 ↓ down 0.8% YoY
Months of Inventory: 3.2 ↑ up 0.6 YoY
Average Days on Market: 61 Days ↑ 12 Days YoY
In Tarrant County, the market continues to show signs of slow, steady cooling. Prices held relatively flat, with just a slight 0.5% increase in average list price compared to last March. The rise in days on market suggests that while homes are still moving, the urgency seen in prior years has faded. Inventory has ticked up slightly, giving buyers a bit more breathing room without dramatically shifting the balance of power.
Denton County
Average List Price: $449,999 ↓ down 3.2% YoY
Median Price per Sq Ft: $206.37 ↓ down 0.5% YoY
Months of Inventory: 3.7 ↑ up 1.2 YoY
Average Days on Market: 60 Days ↑ 10 Days YoY
Denton County experienced one of the more notable shifts this month. The average list price dropped over 3%, reflecting softening seller expectations. Price per square foot held mostly steady, down just 0.5%, suggesting that larger homes may be accounting for more of the inventory. With inventory now at 3.7 months and homes taking 60 days to sell, Denton is firmly in a balanced market — a space where neither buyers nor sellers have a strong advantage.
Collin County
Average List Price: $475,000 ↓ down 3.1% YoY
Median Price per Sq Ft: $206.50 ↓ down 4.3% YoY
Months of Inventory: 3.3 ↑ up 1.1 YoY
Average Days on Market: 61 Days ↑ 18 Days YoY
Collin County saw the steepest decline in price per square foot, down 4.3% year over year. This could indicate increased competition among sellers, especially in mid- to higher-price points. List prices have also adjusted downward, dropping over 3% from March 2024. With average days on market now at 61 — 18 days longer than last year — this county is experiencing the clearest signs of buyer hesitation. However, with inventory at 3.3 months, the market still offers strong opportunities on both sides when expectations are aligned.

Key Takeaways for Buyers and Sellers
Buyers: You now have more time and more listings to choose from than this time last year. Price trends suggest that spring 2025 is a great time to negotiate, especially in higher-priced neighborhoods.
Sellers: Homes are taking longer to sell, and pricing strategies matter more than ever. Lean on expert guidance to ensure your home stands out and moves efficiently in today’s market.
Want a More Localized Snapshot?
Whether you're watching your neighborhood or you're curious about a specific ZIP code, Mosaic Realty Group is here to provide the insight you need. Reach out to us at team@homewithmosaic.com or message us on Instagram — we’re always happy to run a custom report to help you make informed decisions.